
Corrosion silently drains billions of dollars from global industry every year, eating away at infrastructure, shortening asset lifespans, and driving up maintenance costs. Edge AI, however, offers a viable way to detect, and monitor this issue, even deep within challenging industrial environments, with greater speed and precision than traditional methods.
To demonstrate an edge-based approach for pipe corrosion detection, we've built and demoed a compact “inspection‑in‑a‑box” setup that runs three camera streams and three computer vision models concurrently, fully offline, and shown them at recent trade shows including GITEX Global 2025.
This post focuses on getting a robust project trained in Edge Impulse quickly, then deploying it to edge hardware (in our case the Codico/JMO platform), and finally wrapping it up in a simple on-device GUI.
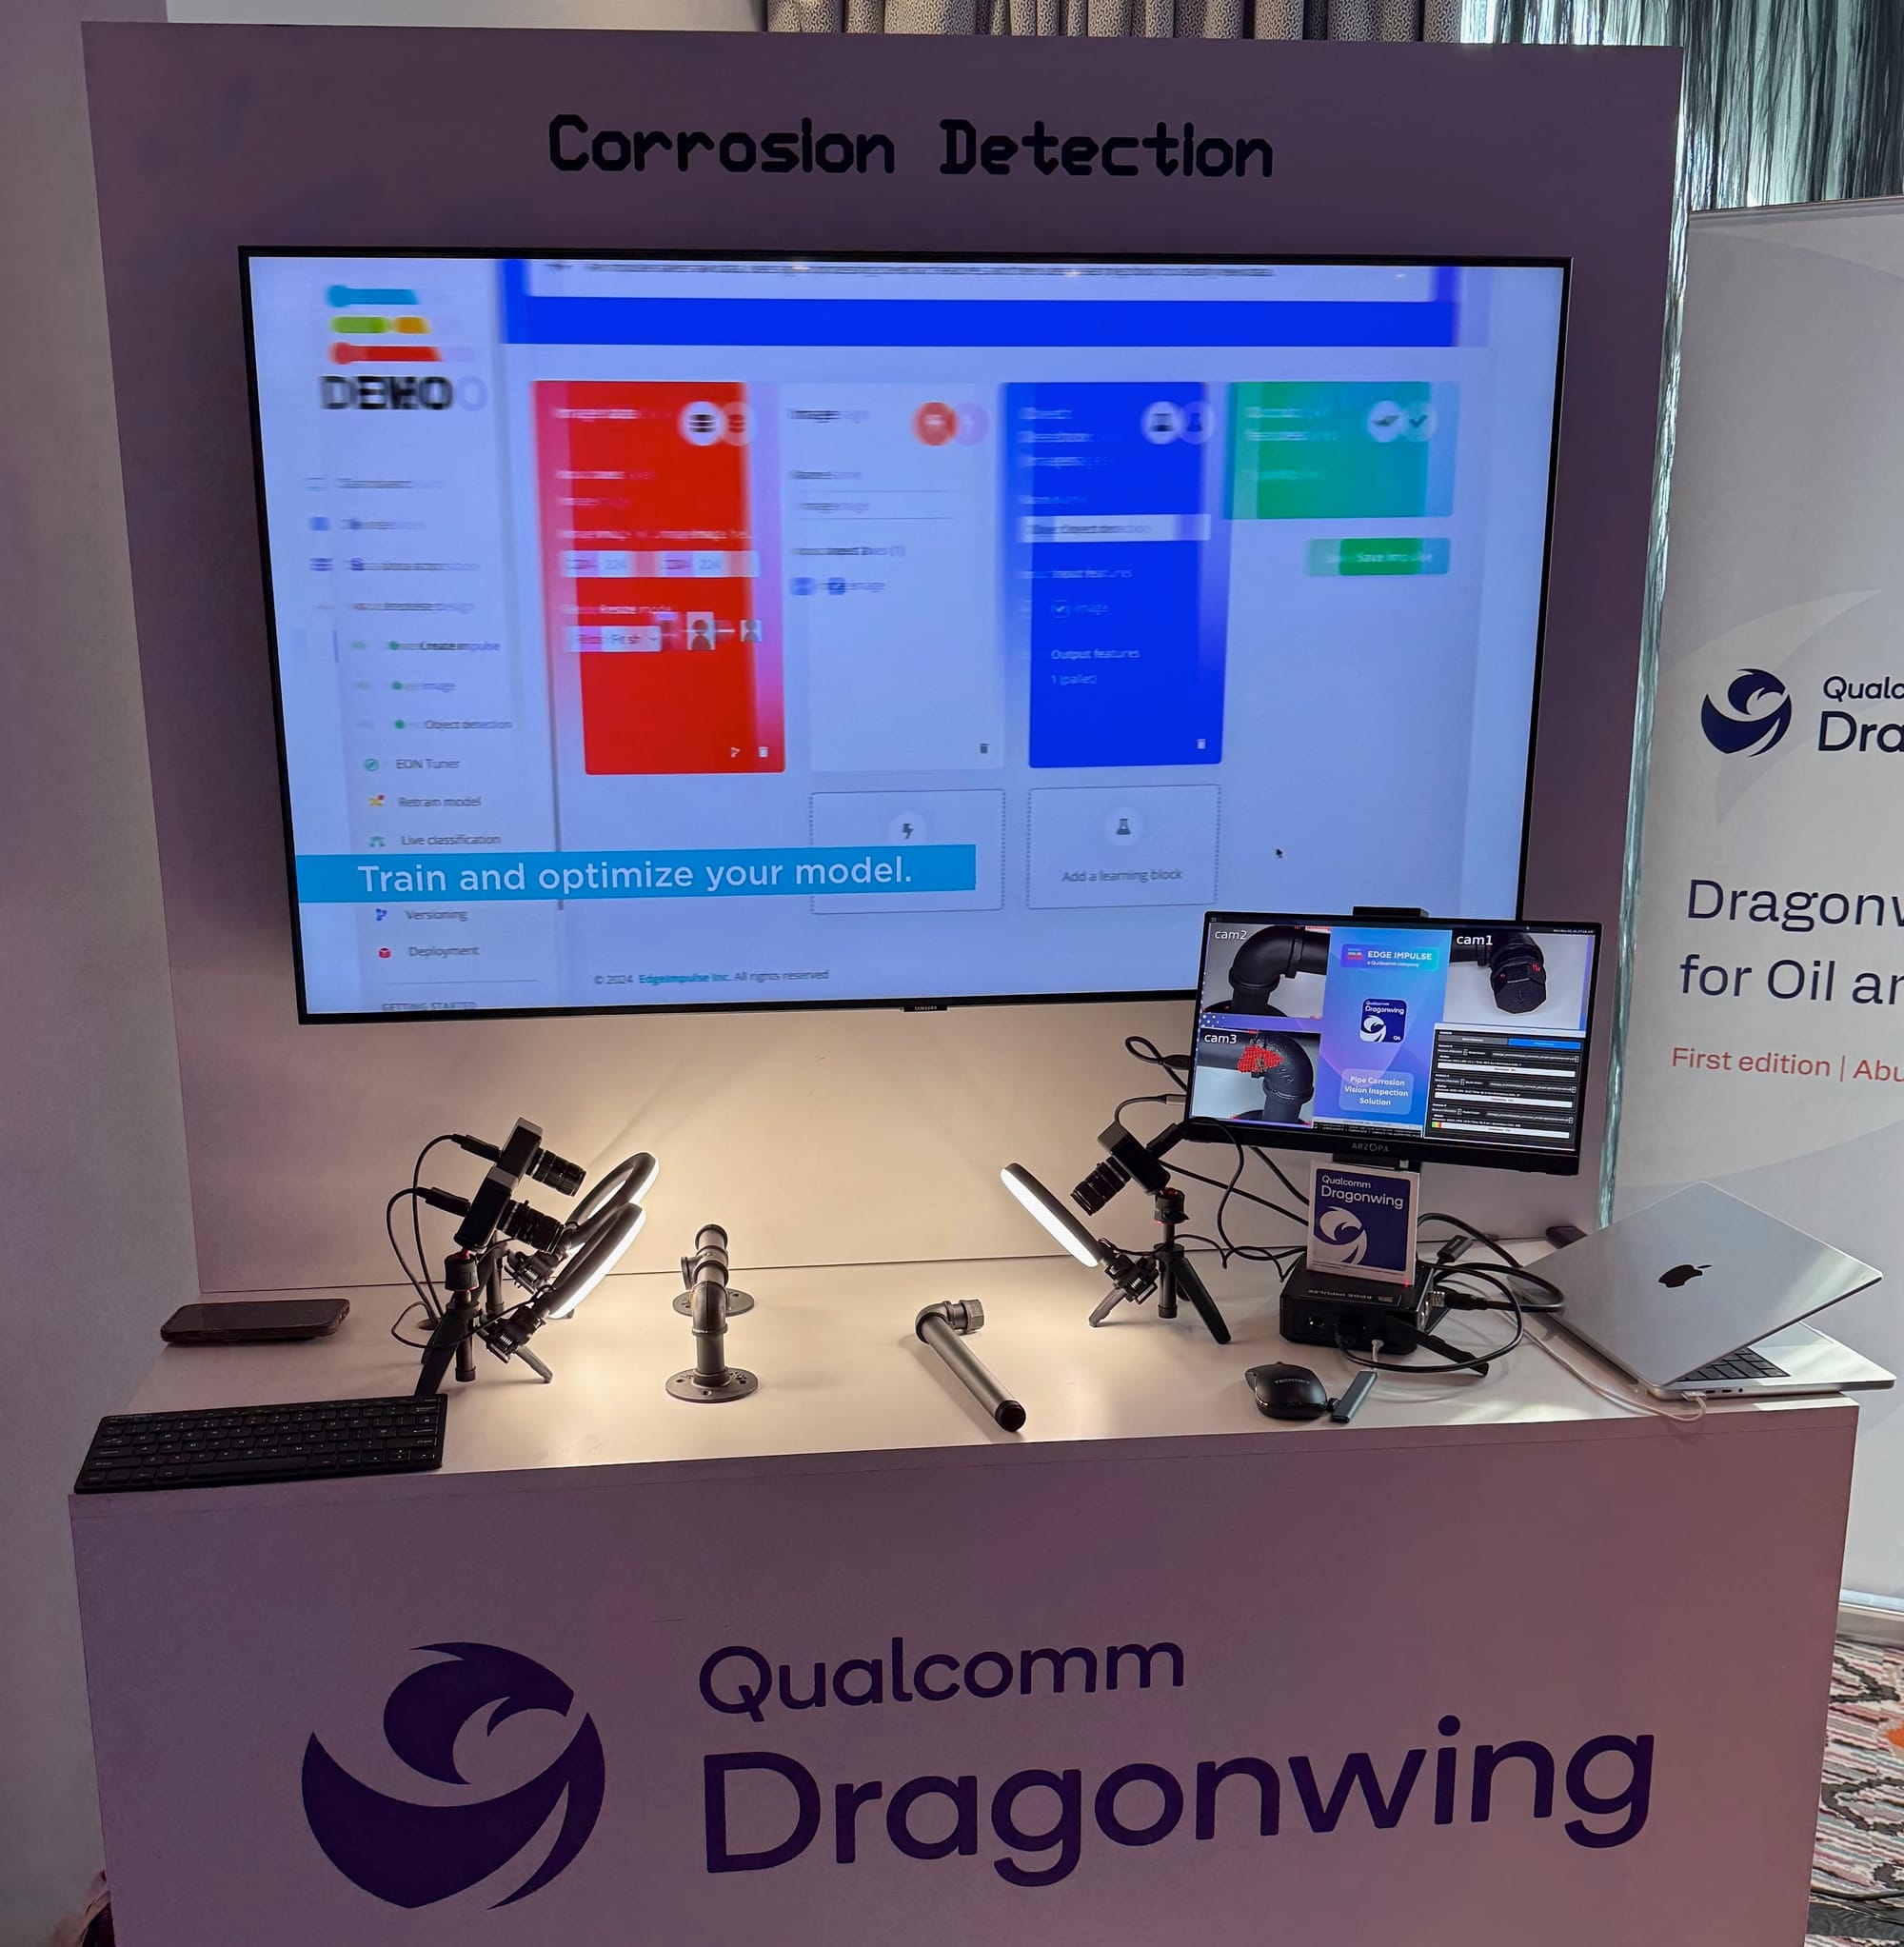
What we showed on the booth
- On-device visual inspection of pipes and valves
- Three concurrent cameras, each running a model in parallel
- No cloud dependency at inference time (no internet, no server)
- A lightweight GUI to make the demo feel like an appliance
Hardware (and why this is not hardware-specific)
For the trade show demo we used the PERSPEC‑1 Industrial Vision AI Solution (Codico + JMO), based on the Qualcomm Dragonwing™ QCS6490.
The important part, though, is that the workflow is not locked to one device. Once the model is trained in Edge Impulse, we can deploy to many different targets (Linux edge devices, camera gateways, industrial PCs, etc.). The PERSPEC‑1 is simply a great example of a multi-camera industrial platform where “3 streams in parallel” is the point.
If you’re using the PERSPEC‑1 platform, the bring-up guide is here: docs.edgeimpulse.com/hardware/devices/jmo-triple-vision-camera
Step-by-step: building the corrosion project in Edge Impulse
Corrosion is a classic inspection problem: defects can be diverse, while “normal” examples are plentiful. For the trade show we used Visual Anomaly Detection, which works well when you can collect lots of “good” images and want the model to flag deviations.
In our recorded booth walkthrough, the dataset was intentionally small (around 115 images) to show how fast you can get a working baseline in a controlled setup.
1) Create a project
Create a new project in Edge Impulse Studio and choose an image workflow.
2) Collect data (images of normal / good pipes)
For anomaly detection, we start by capturing images of good pipe surfaces under consistent lighting.
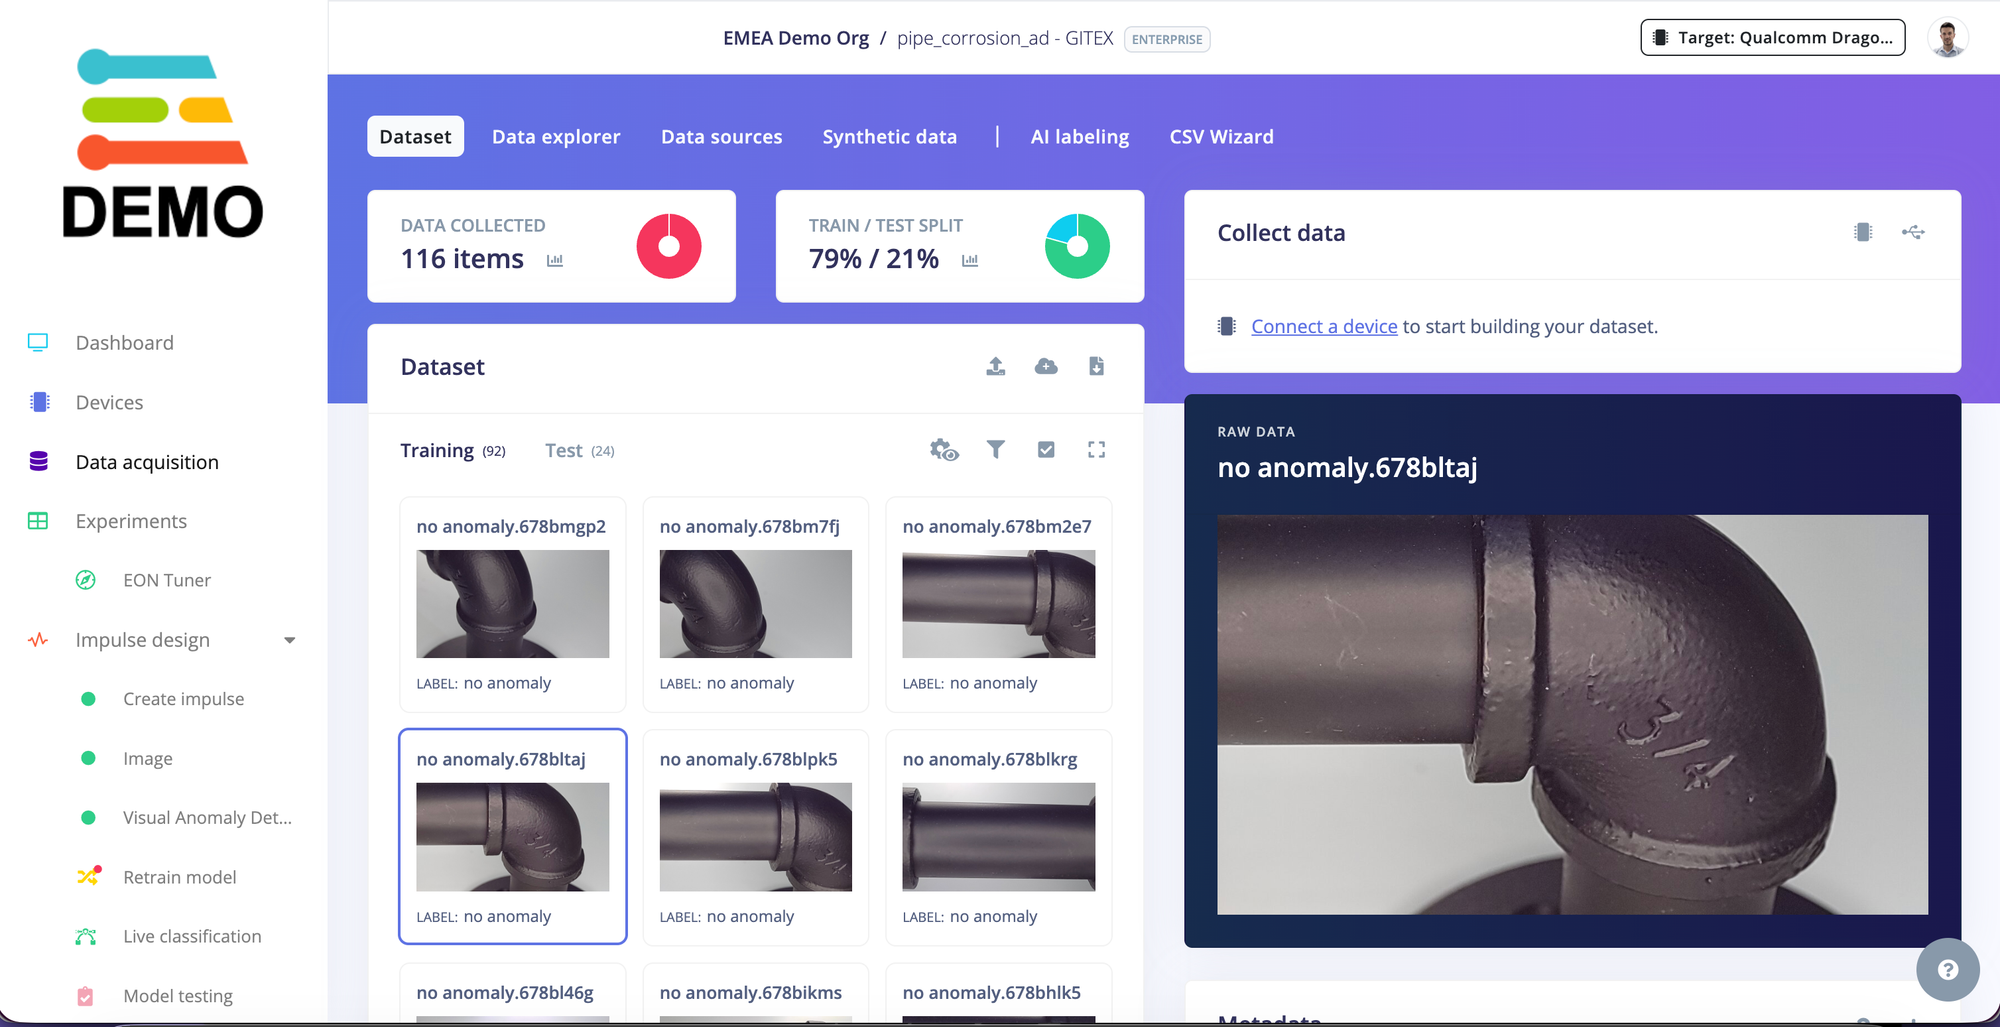
If you’re connecting a live camera to Studio for data collection (recommended for quick iteration), keep the capture setup stable:
- fixed distance to the object
- stable lighting (ring lights help a lot)
- minimal background variation
3) Design the impulse
In Studio, define your impulse for image ingestion and feature extraction.
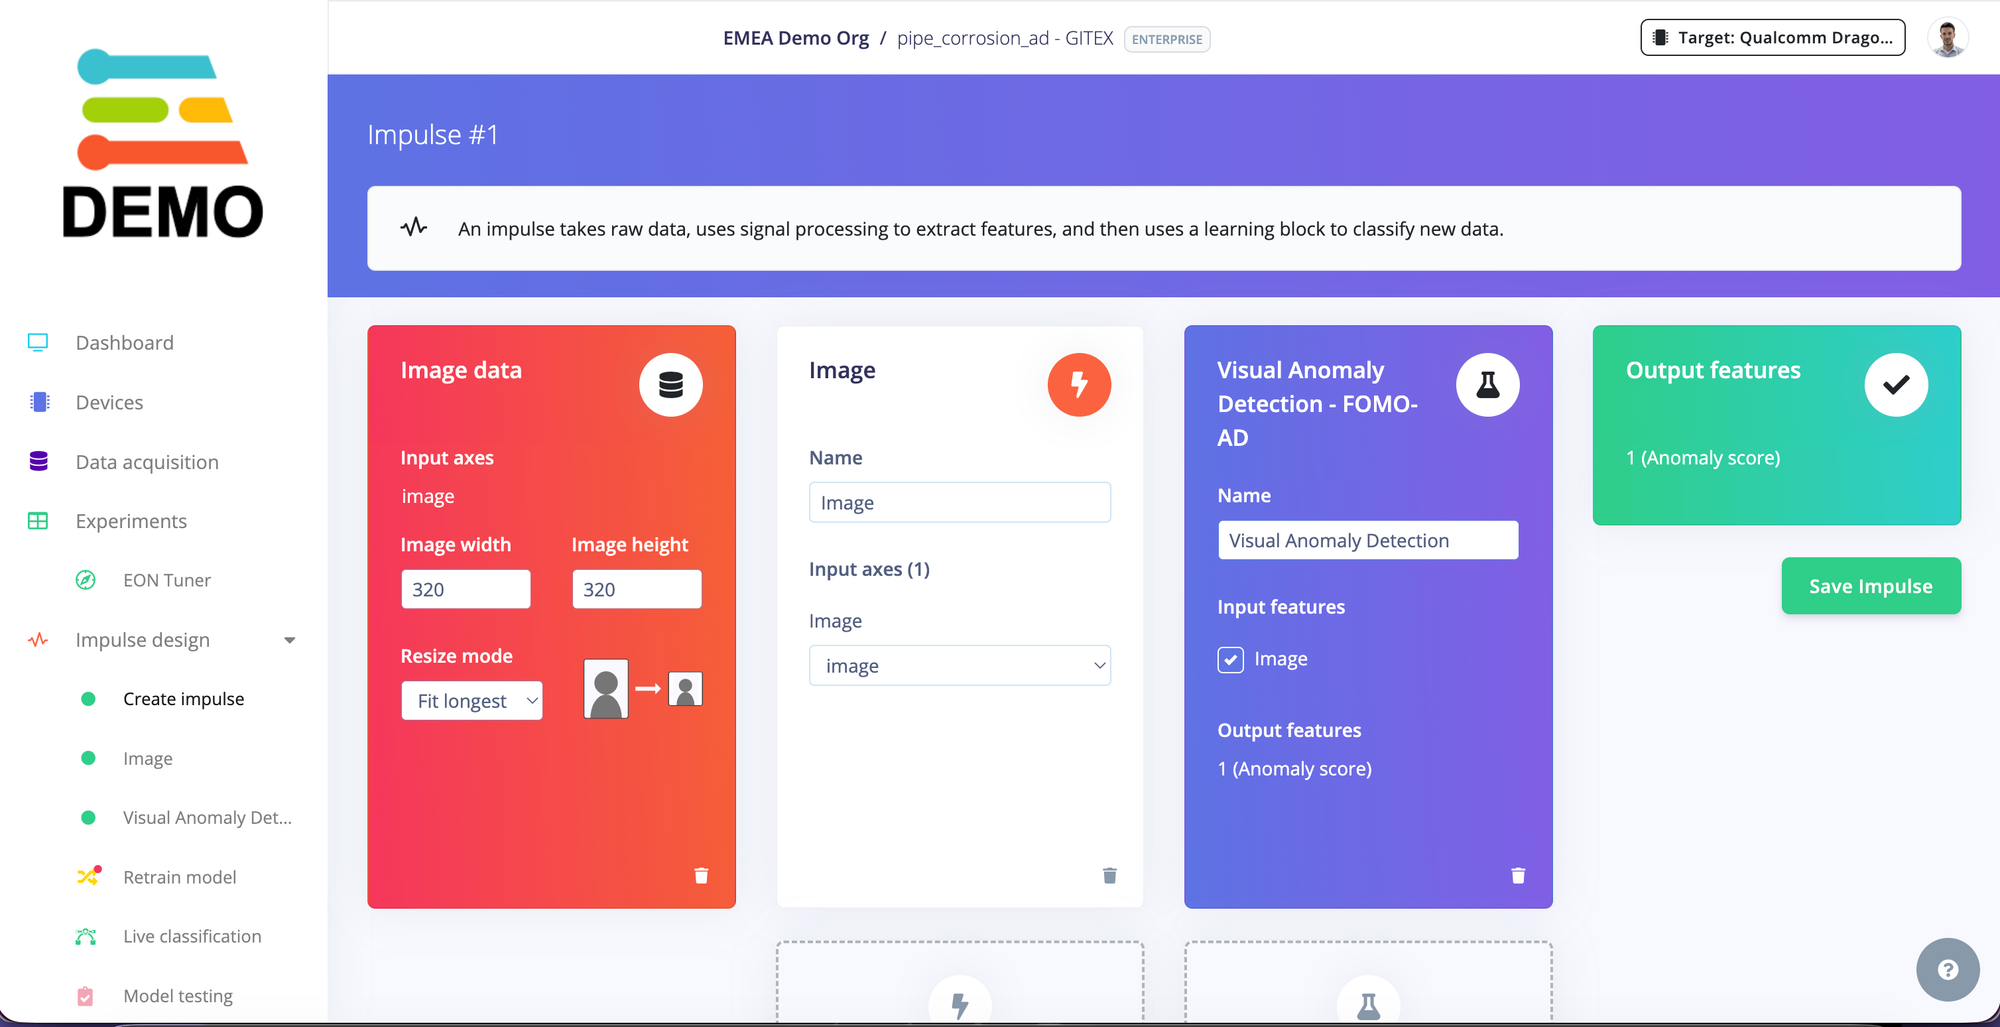
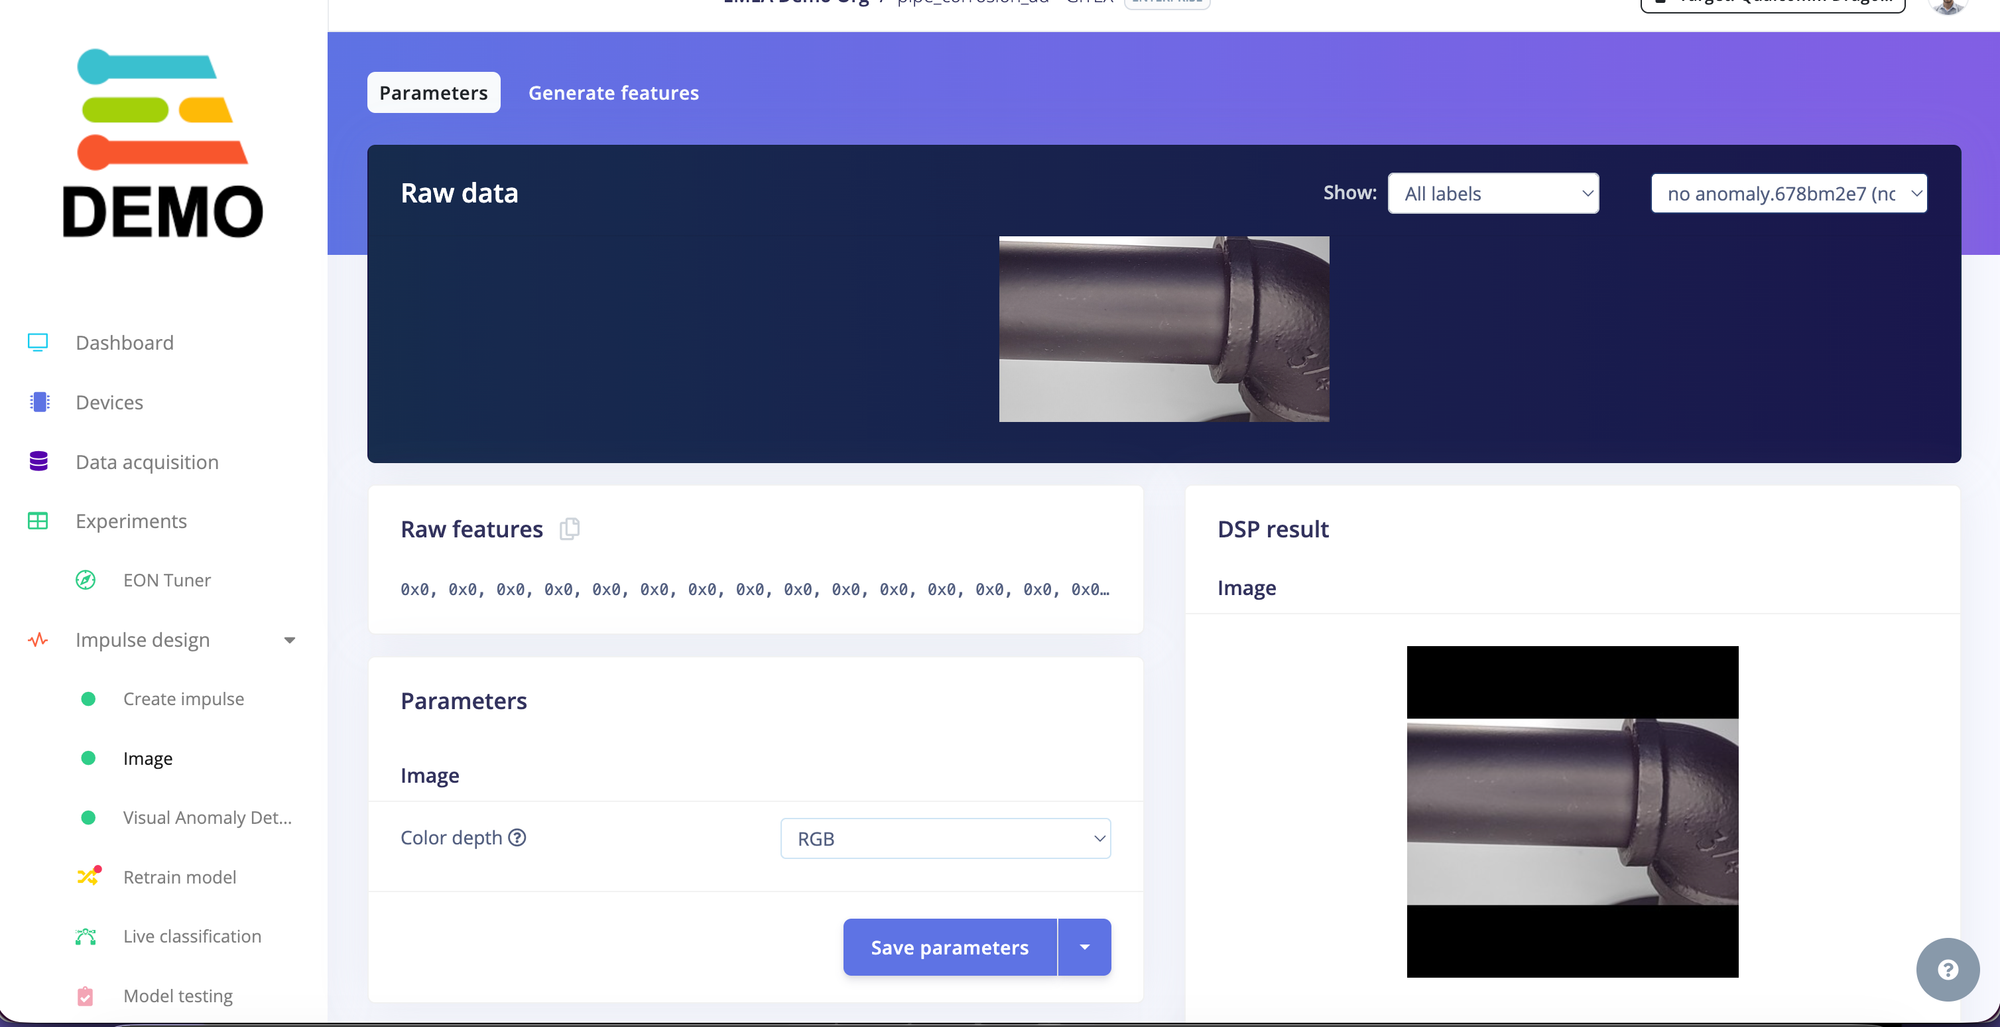
4) Configure image preprocessing
Preprocessing is where we make the model’s life easier (resizing, cropping strategy, color format). For surface inspection, consistency matters.
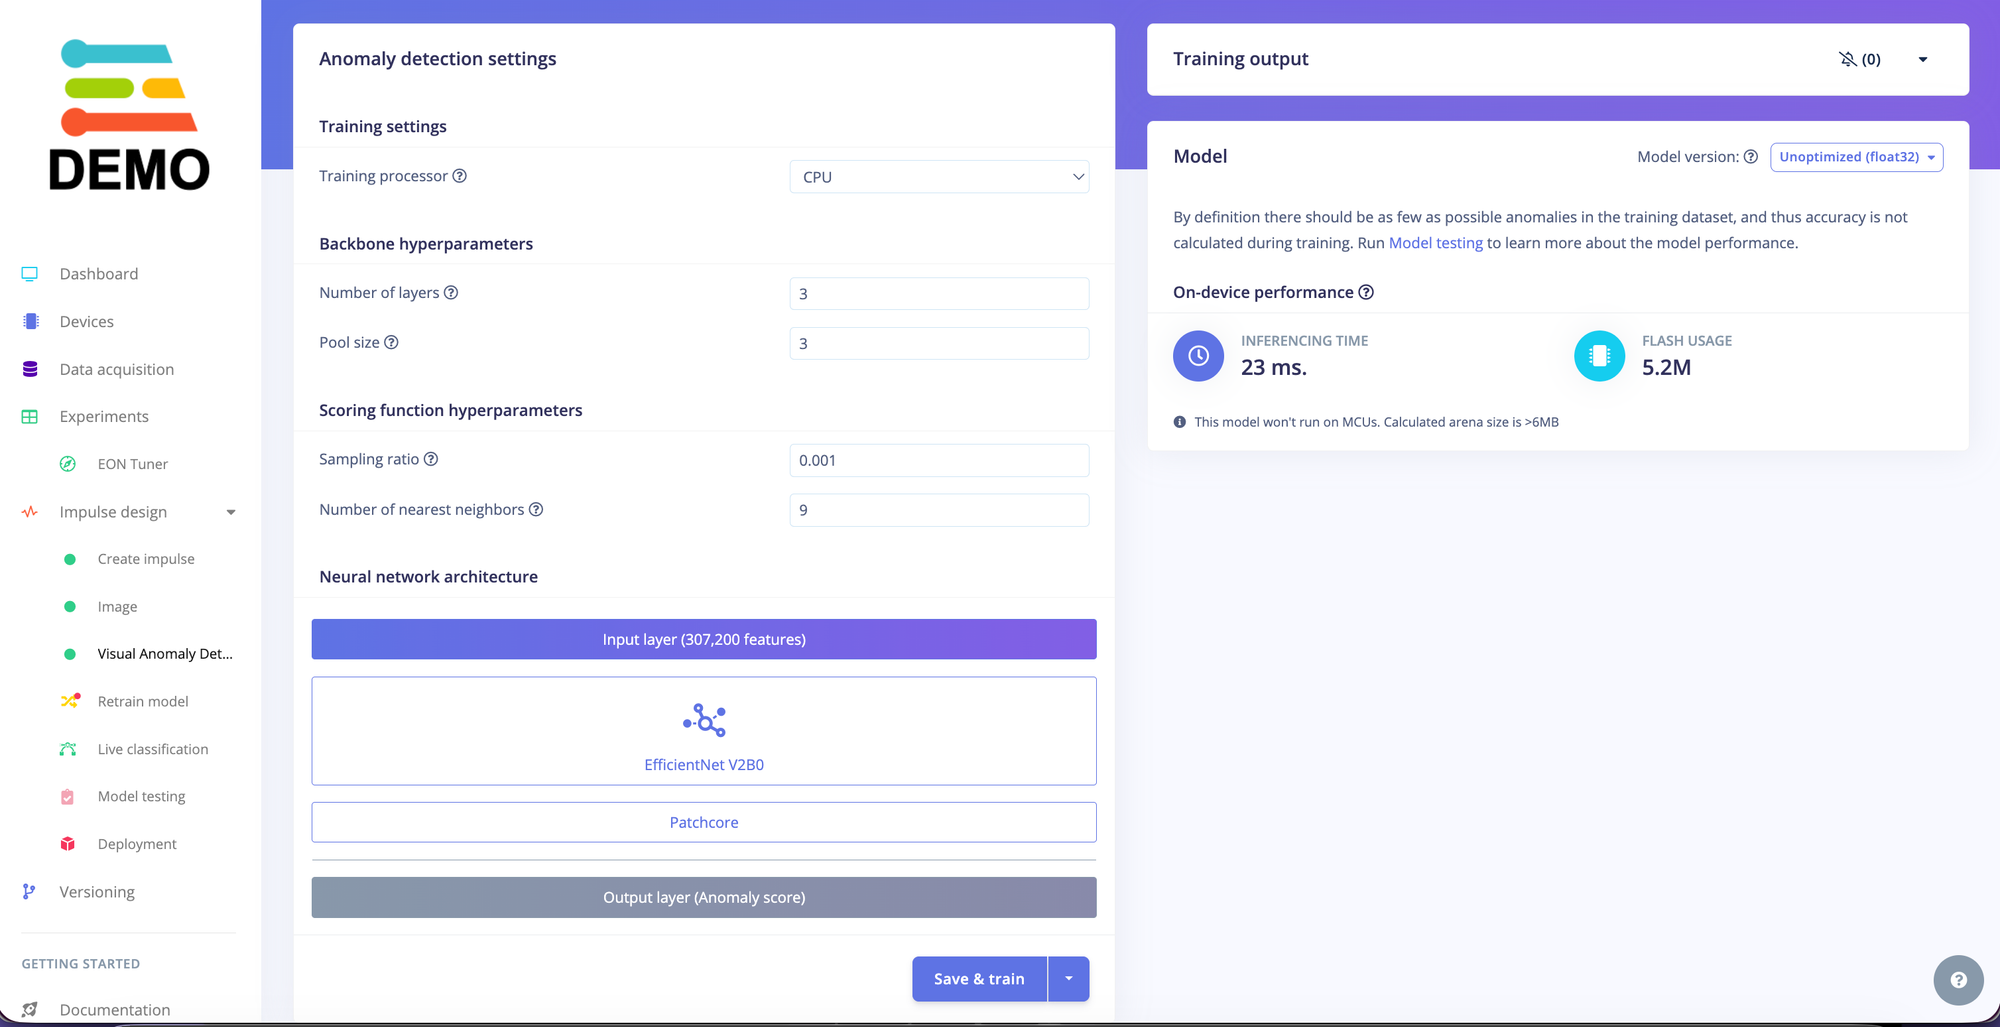
5) Train the Visual Anomaly Detection model
Train the anomaly model on normal images. The model learns what “good” looks like and flags anything that doesn’t match.
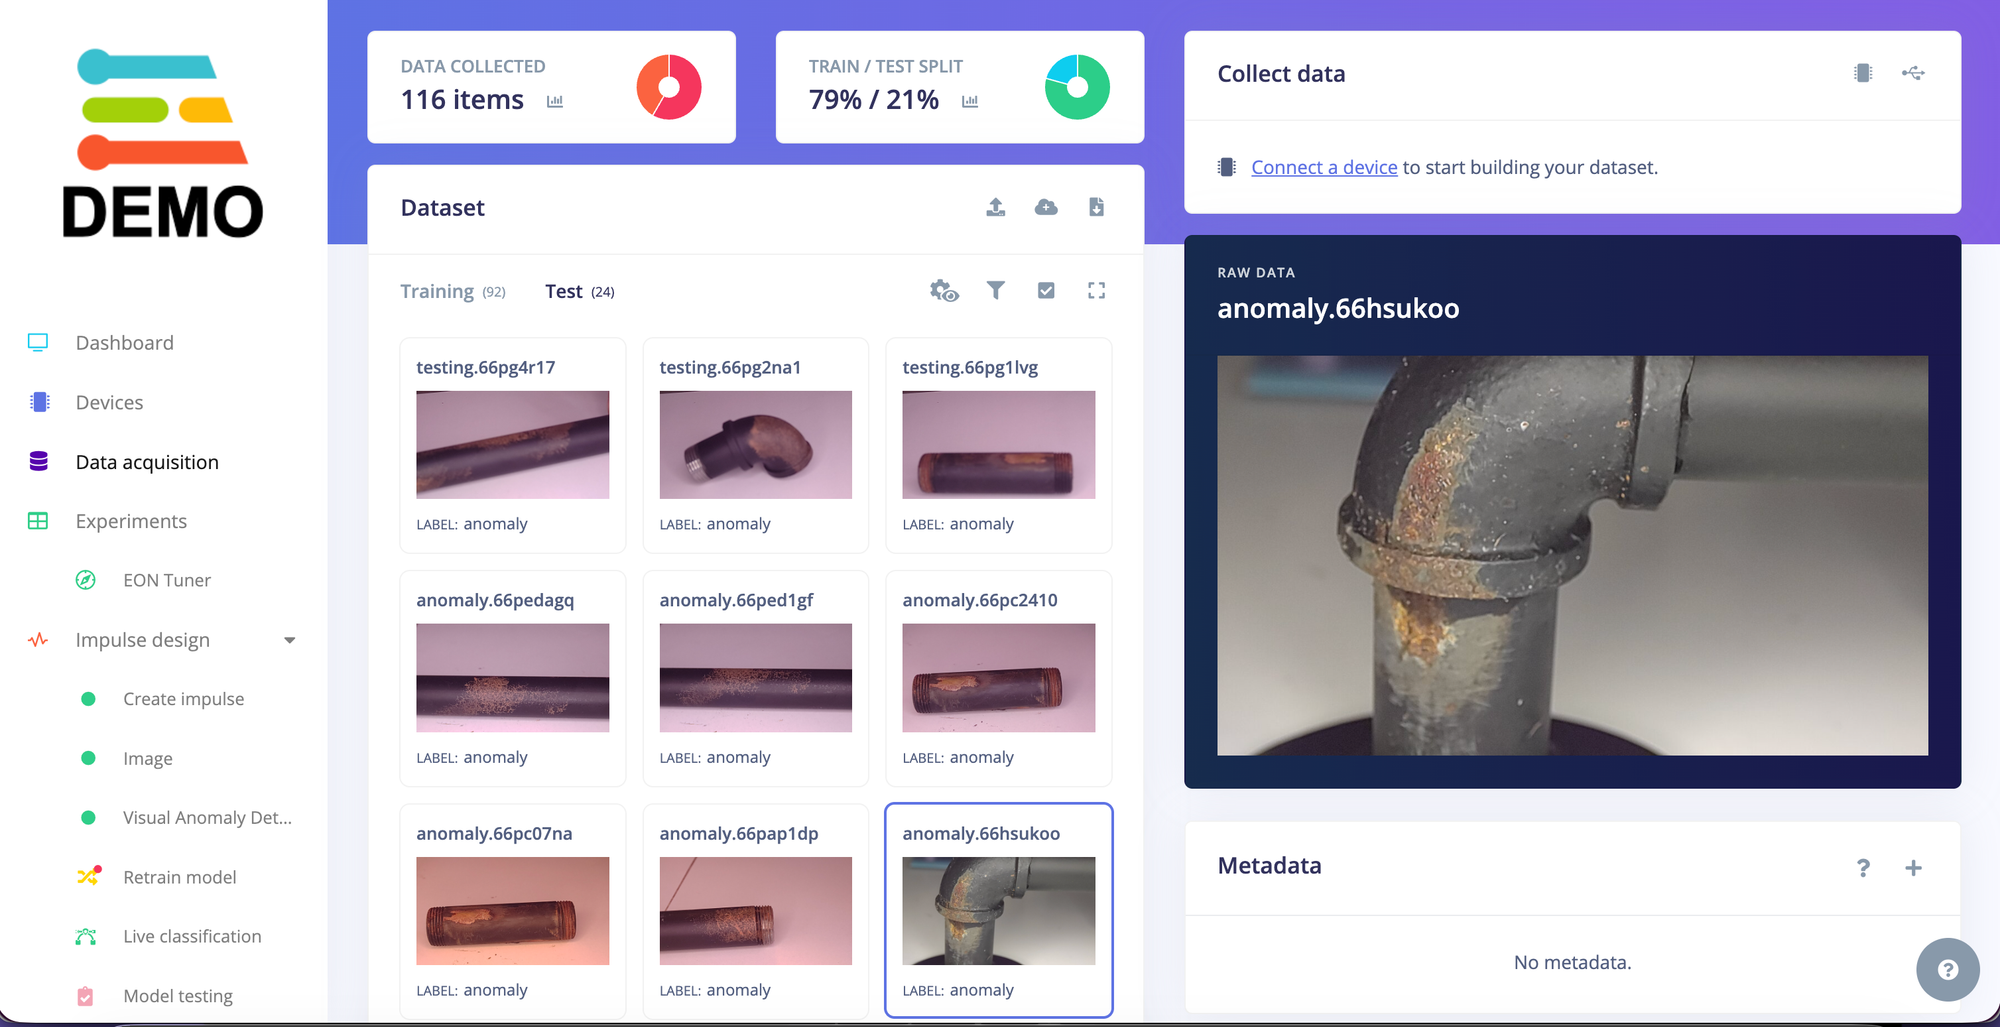
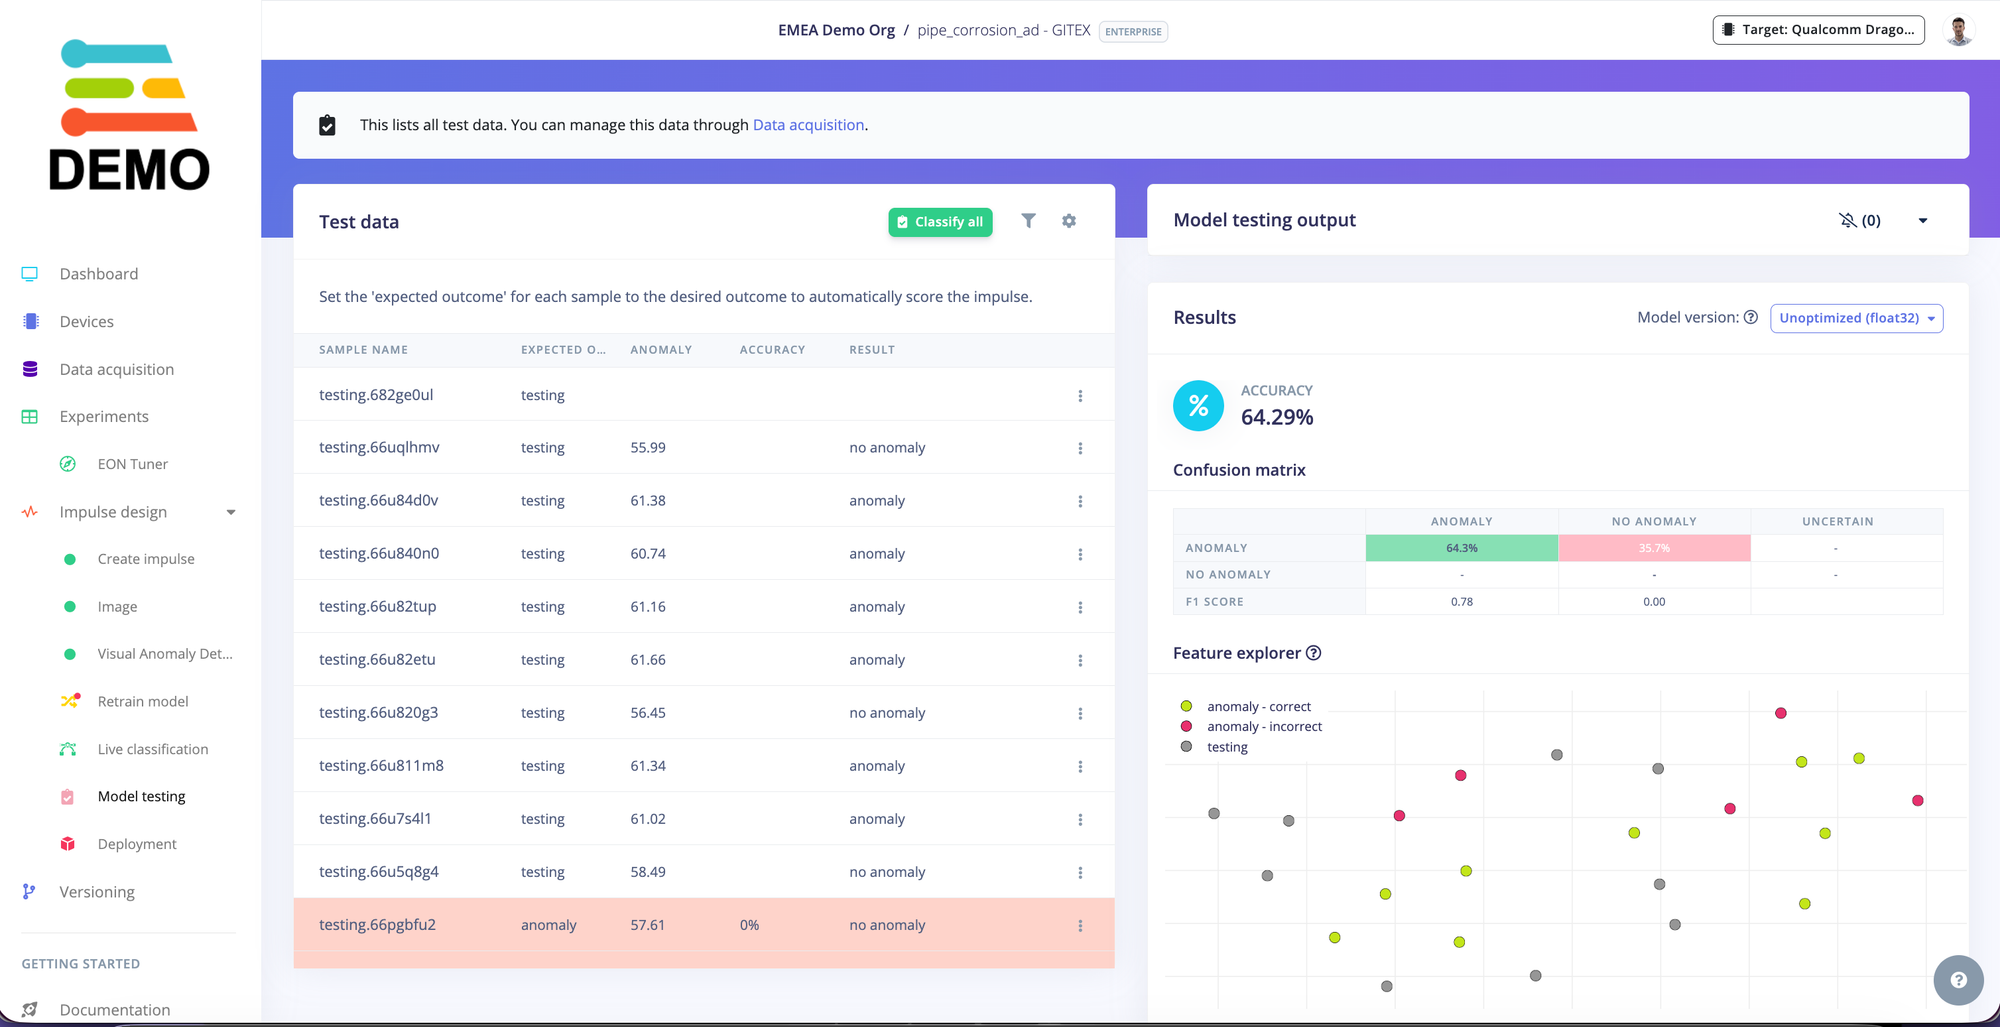
6) Validate on test images
After training, test with:
- additional good samples (to check false positives)
- corroded / defective samples (to confirm it flags anomalies)
Deployment: running the model on edge hardware
Once the model looks good, export it from the Deployment tab. This is where the project becomes a real demo: the model is now a portable artifact you can run on many devices.
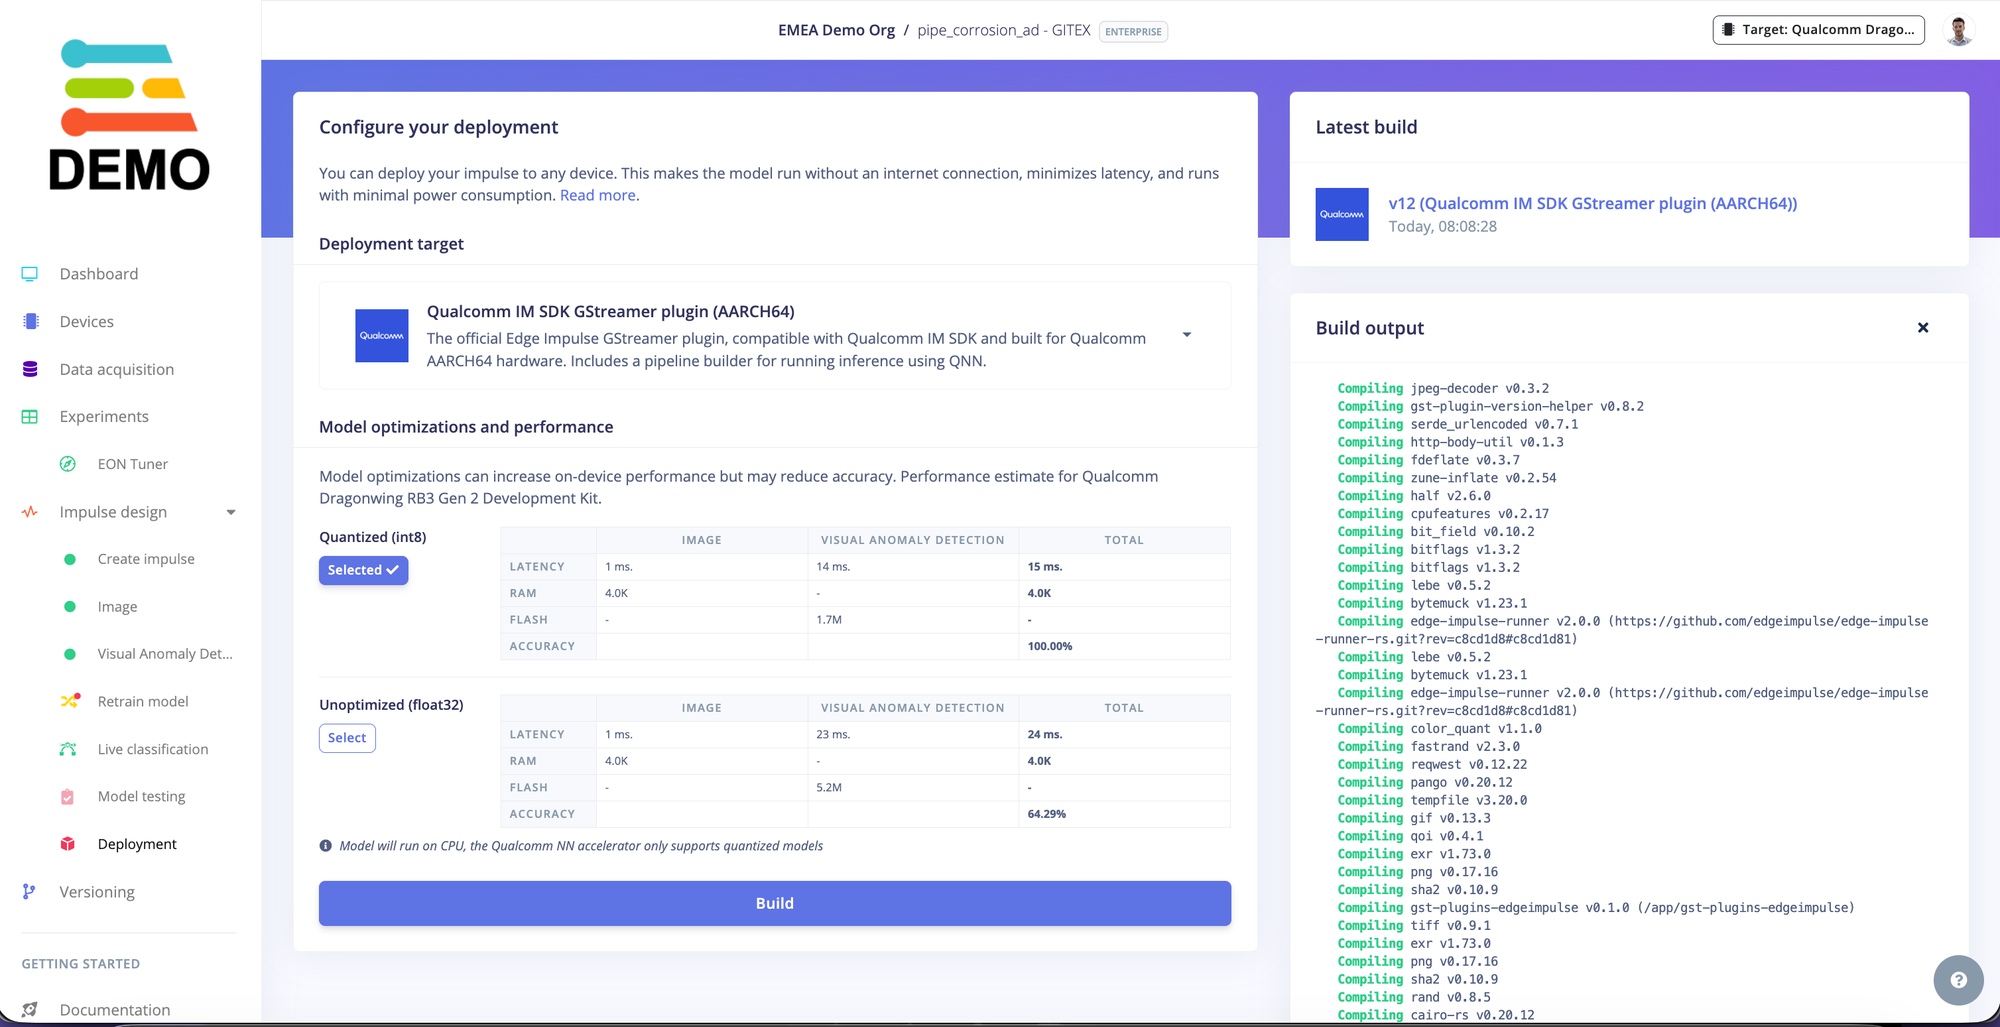
For this demo, we ran everything on the PERSPEC‑1 (QCS6490) platform, and showed three concurrent streams.
On Linux-based targets, there are a couple of common approaches:
- Edge Impulse Linux runner (quickest way to get started)
- GStreamer + Edge Impulse plugin (great for low-latency streaming pipelines)
The multi-camera GUI (and the repo)
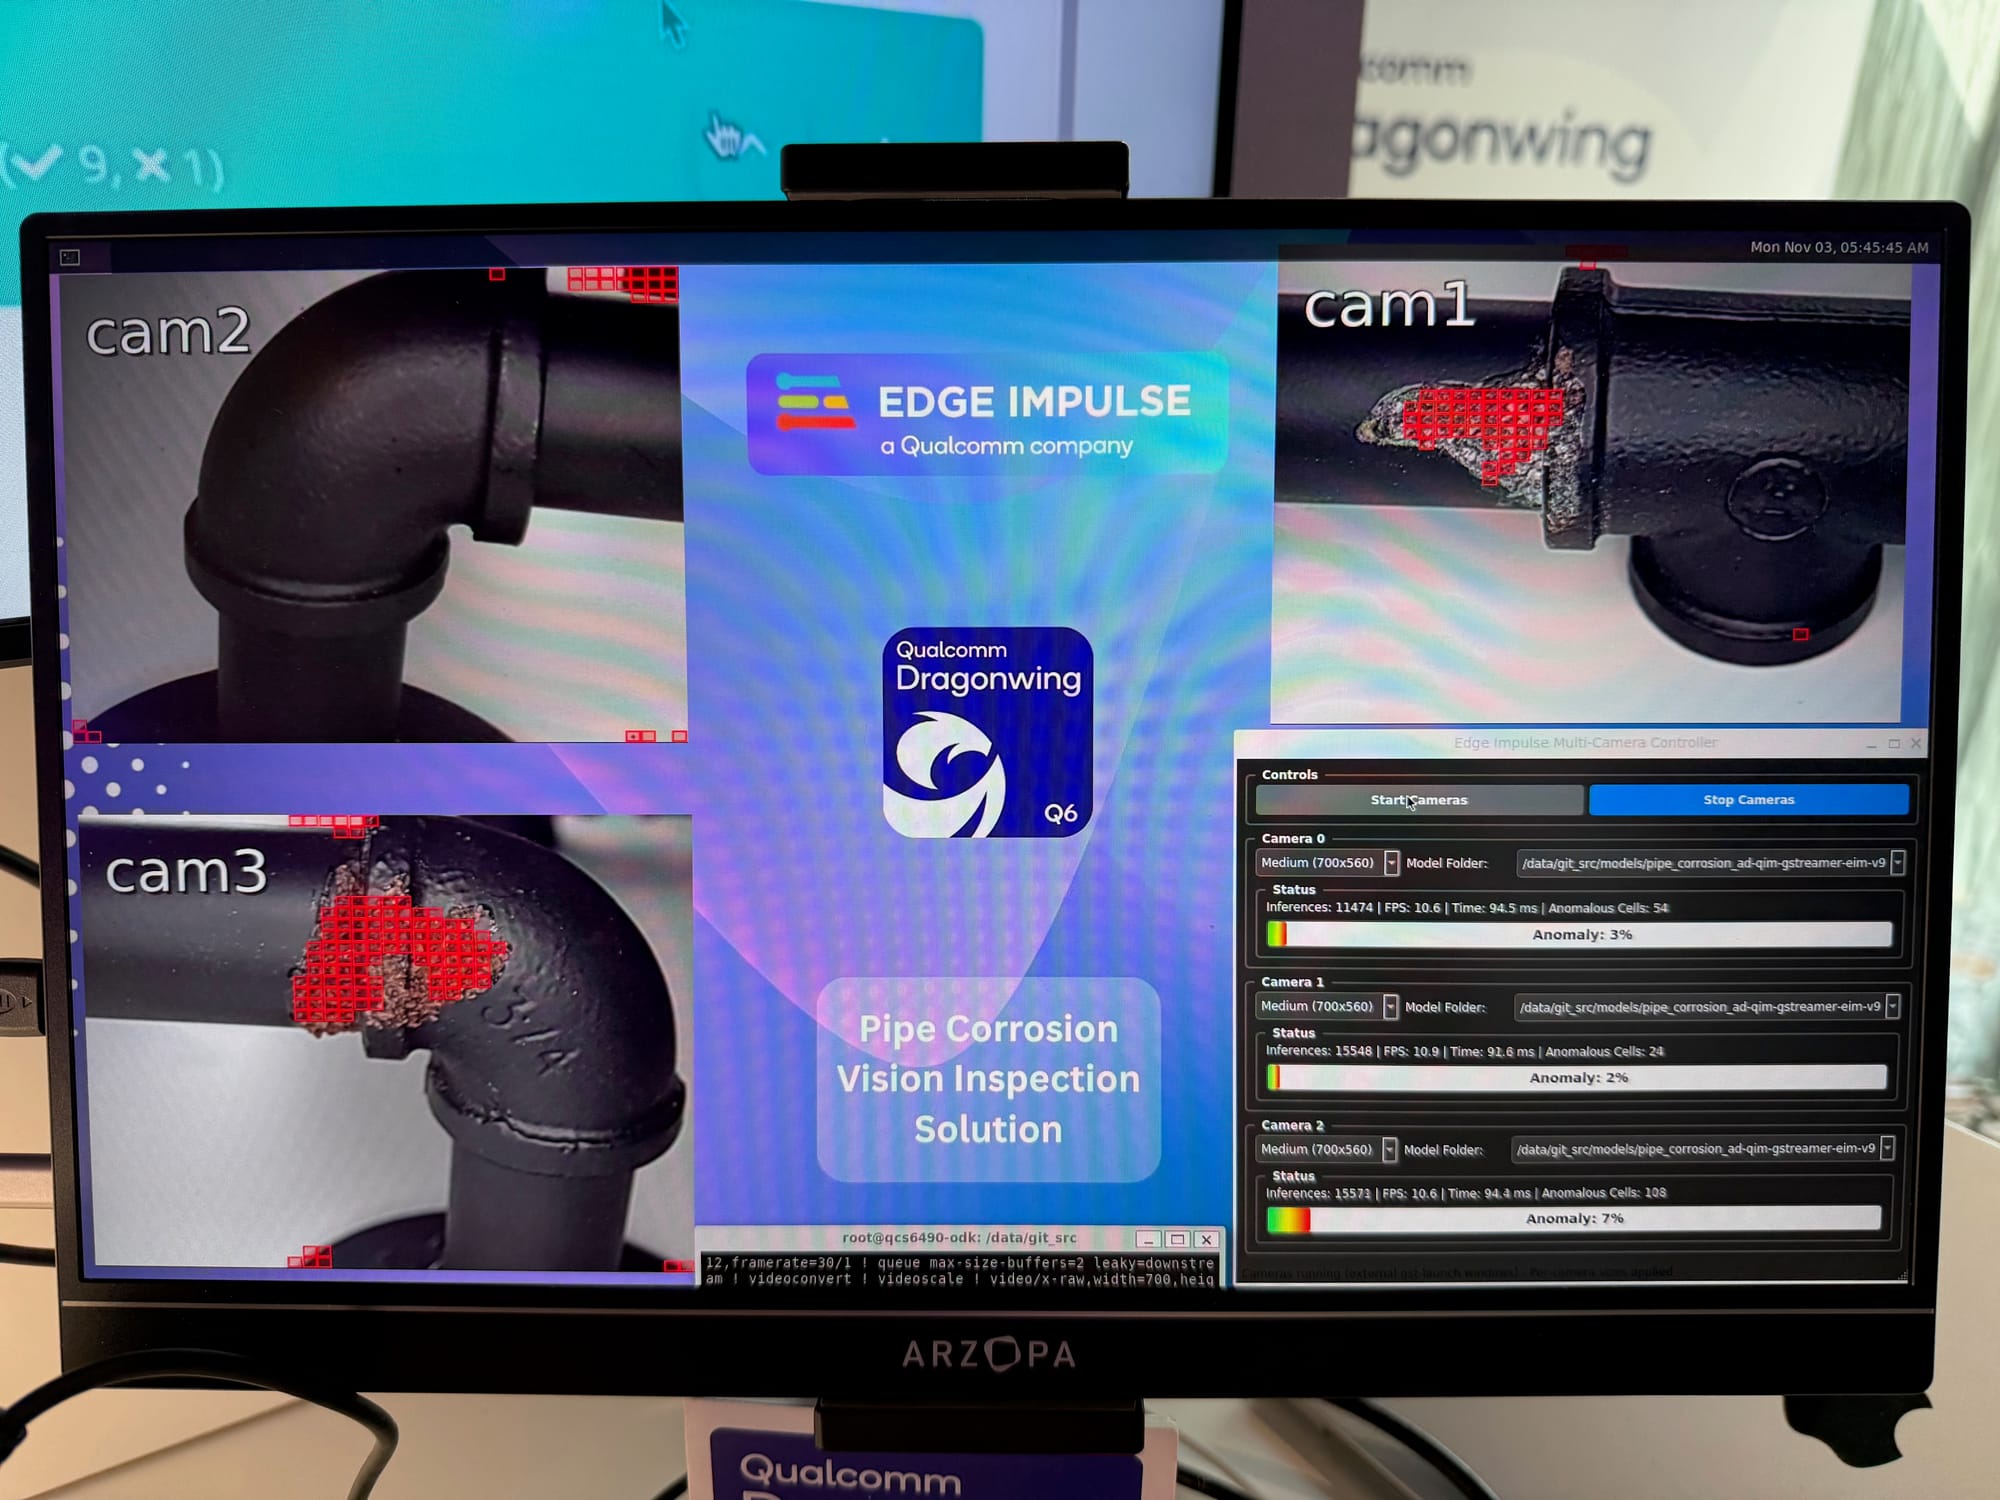
To make the demo trade-show friendly, we wrapped the three streams into a simple Qt GUI so visitors could instantly see:
- three live camera views
- overlays / scores
- basic metrics
What the GUI offers
The GUI is designed to make multi-camera demos and pilots easy to operate on the device. In particular:
- Per-camera model selection: we can drop multiple models onto the device and select which one to run via a drop-down (so switching between “corrosion”, “scratches”, “missing part”, etc. is a few clicks—not a rebuild).
- At-a-glance anomaly level: each feed includes a clear visual progress bar indicating how anomalous the current frame looks.
- Real-time performance telemetry: we surface the numbers you actually care about during live streaming.
Metrics shown per feed
Depending on the selected model type, each camera view can display:
- FPS (frame rate)
- Inference time
- Anomaly score / anomaly level (visualized as a progress bar)
- Number of anomalous cells (useful for Visual Anomaly Detection, as a quick proxy for “how much of the image is anomalous”)
This makes it easy to compare cameras side-by-side, tune the setup (lighting/distance), and spot when a model is either too sensitive or not sensitive enough.
The GUI and helper scripts live in this repository: github.com/edgeimpulse/codico-ai-box-demo
- README.md covers runner-based examples and setup notes
- other_codes/README.md includes additional GUI variants and GStreamer examples
- We will soon publish the code for the GUI as well, so keep an eye
On Wayland targets, the main Qt demo can be launched with:
QT_QPA_PLATFORM=wayland python3 ei_multi_camera_qt.py
Conclusion (and what to do next)
This demo started as “pipe corrosion detection”, but what we ended up showcasing at events was something broader: a practical, repeatable way to go from a real-world visual problem to an on-device solution quickly.
In conversations at trade shows, the part that consistently resonated was the full loop:
- capture a small dataset from a real camera setup,
- train in Edge Impulse with a workflow that matches the problem,
- and deploy back to the target so it runs locally in real time.
Where else this applies
The same approach can be adapted to many applications, including:
- Surface defects (scratches, dents, corrosion, coating issues)
- Assembly verification (missing components, wrong part, misalignment)
- Packaging QA (seal defects, contamination, label/print issues)
- Asset condition monitoring (rust, wear, cracks)
- And many more!
Want to see it live or try it on your use case?
If you’d like to run this demo on your own hardware, adapt it to a different anomaly, or discuss what “productionizing” would look like, we’d love to connect: Book a meeting.