
At Edge Impulse we believe that signal processing is key to embedded Machine Learning and we try to leverage the decades of industry knowledge around signal processing before even applying a machine learning model. To help developers choose better parameters for their signal processing blocks, and to show whether a model will fit the latency and memory constraints that their application has, we now introduce real-time performance metrics for all processing blocks in the Edge Impulse Studio.
To see the real on-device performance of any block, just head to the Edge Impulse Studio and find your processing block under ’Create Impulse’. The on-device speed per inference (the time to process one frame of data) and the peak RAM usage are listed in the bottom right corner.
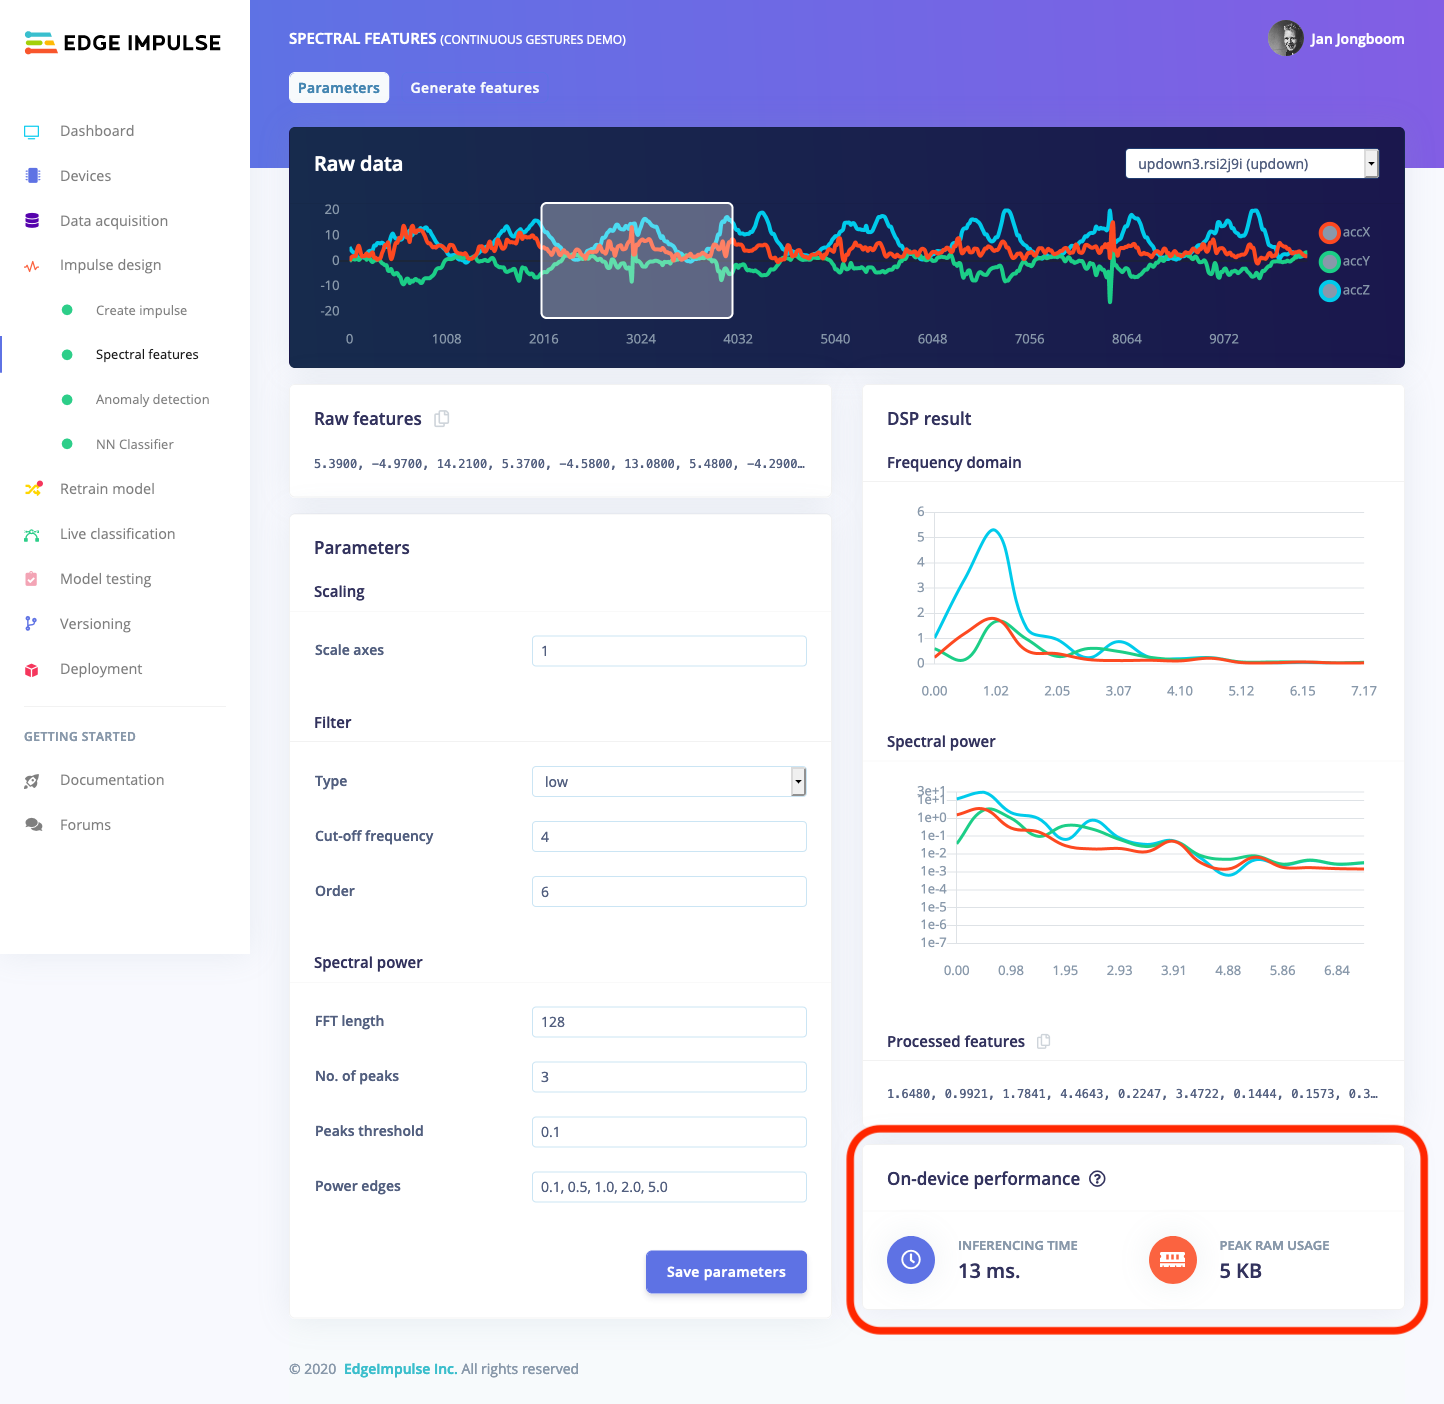
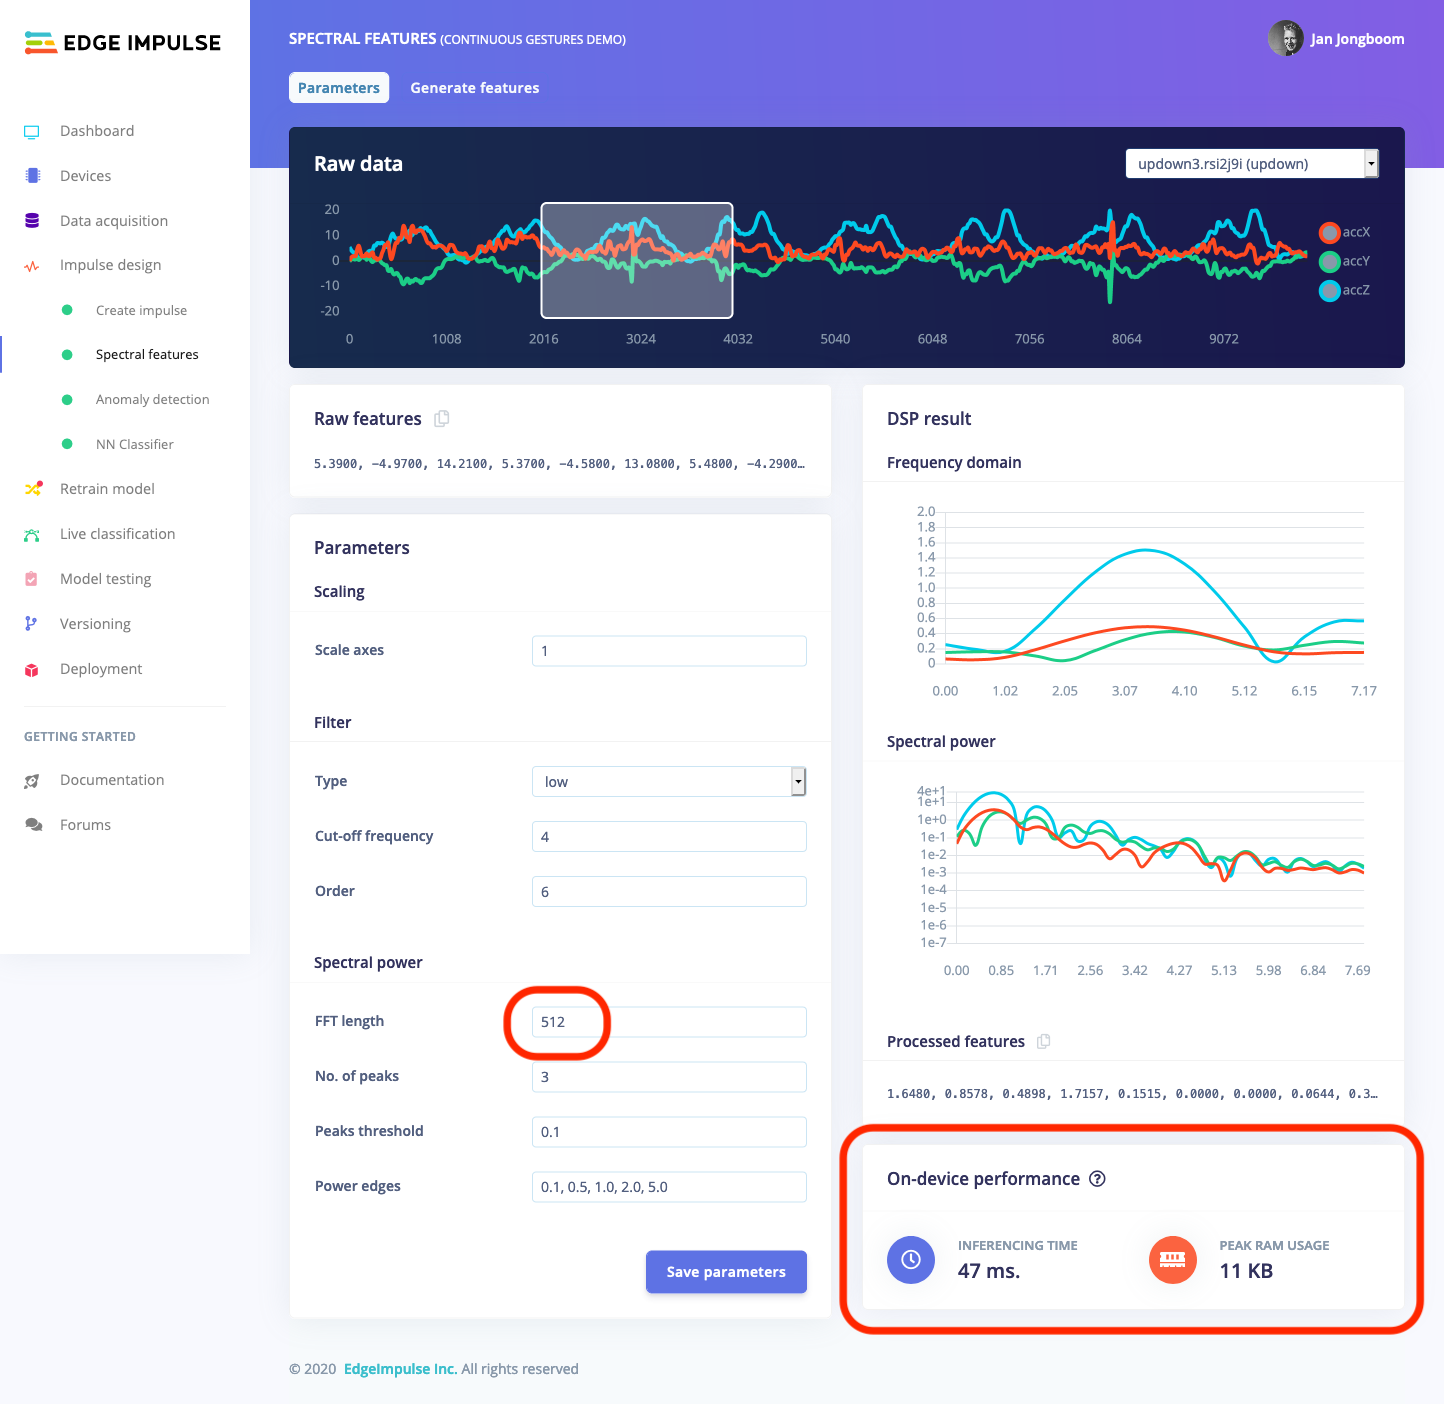
The great part is that this section is updated in real-time when you change any parameters. For example, if you update the FFT length to 512 you’ll instantly see the impact that this change has on the performance of your model.
These performance metrics are calculated either on a Cortex-M4F or a Cortex-M7 device, depending on your type of model - but you can easily change it to another device. All fully supported development boards in Edge Impulse can be chosen for these metrics. To change them, just head to your Dashboard, and under ’Project info’ find ’Latency calculations’.
Wait, how does this work?
We’ve had performance characteristics for neural networks for a long time already (just head to any neural network or transfer learning block in Edge Impulse), but those were calculated based on the number of operations in the network, combined with the RAM and ROM usage we got from EON - our neural network compiler. But signal processing blocks have proven to be more difficult.
The hardest part is that we heavily leverage hardware acceleration for our DSP code. It’s easy to calculate the number of cycles we need to run on a server to calculate an FFT, or to see how much memory we use (we have memory tracing functionality in our SDK, see dsp/config.hpp) when running on a computer - but this does not tell us anything when we use use (for example) CMSIS-DSP to run the FFT.
The solution? Renode - an open source simulator by Antmicro that supports a wide variety of MCUs. We now run Renode in the background for every request to our DSP service, run the actual algorithm (as it would run on device) in the simulator, and pull the performance characteristics out. This is a great step forward, and we can now add or update our signal processing algorithms without being worried that our performance characteristics stop work.
Recap
Every embedded machine learning model has constraints - Whether you’ll need to run a model at least 10 times per second for safety reasons, or just have 20K of RAM left. And the Edge Impulse Studio is here to help. With the performance characteristics for both signal processing and machine learning blocks you quickly get an accurate view of the latency, RAM and flash requirement of your complete model and all dependencies (the memory numbers include all dependencies, static and runtime allocations).
The performance metrics are now automatically enabled for all built-in processing blocks in Edge Impulse, whether you’re building vibration, audio or vision models. Excited to get started? Find our guides building embedded Machine Learning models here - you can get started with just your mobile phone!
-
Jan Jongboom is the CTO and cofounder of Edge Impulse. He loves simulating things.