
You’ve been asking for them. I’ve been asking for them. Everyone has been asking for them. Well, the wait is finally over!
At Edge Impulse, we’re always working to make your edge AI development experience faster, clearer, and more intuitive. And while we have released some advanced features over the years, there has been one basic request that has continued to come up again and again: model training graphs.
Yes, we know it’s one of those foundational features that feels like it should have been a part of Edge Impulse Studio ages ago but… it wasn’t (although it was definitely discussed!). So we’re especially happy to say they are finally here. Not only that, we also took it one step further and developed an integration with TensorBoard, a popular, open-source visualization toolkit for machine learning experimentation. With one click, you can jump into the full TensorBoard experience to explore advanced visuals, compare runs, and dig deeper into your training results. Pretty neat, eh?
What are model training graphs?
Training graphs provide visual insights into the performance of your machine learning model during the training process. These visualizations help you understand how well your model is learning by identifying issues — overfitting, underfitting, unstable learning, or convergence issues, for example — and can guide you in making adjustments to improve its accuracy and efficiency.
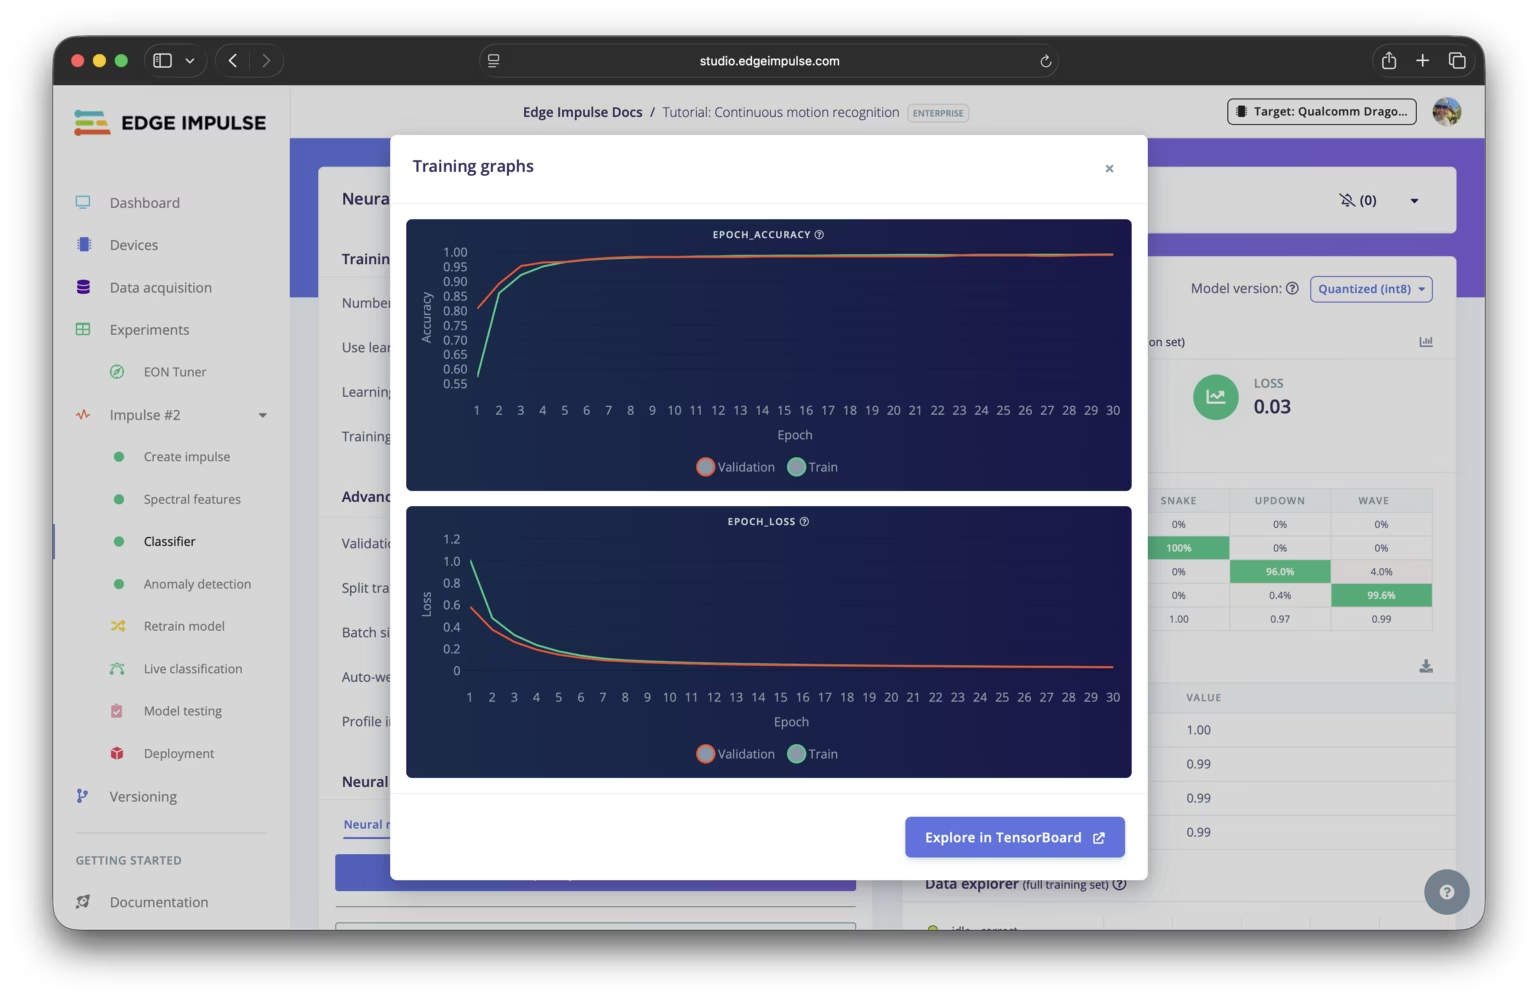
In Edge Impulse Studio, the graphs that are shown are the accuracy and loss over epochs for both your training and validation data.
Viewing training graphs in Studio
Training graphs in Edge Impulse Studio can be found on the learning block configuration page. After training is complete, you can view the accuracy and loss graphs by clicking the graphs icon near the upper right corner of the model performance overview pane. This will open a modal displaying the graphs, allowing you to analyze the performance of your model over the training epochs.
Exploring more with TensorBoard
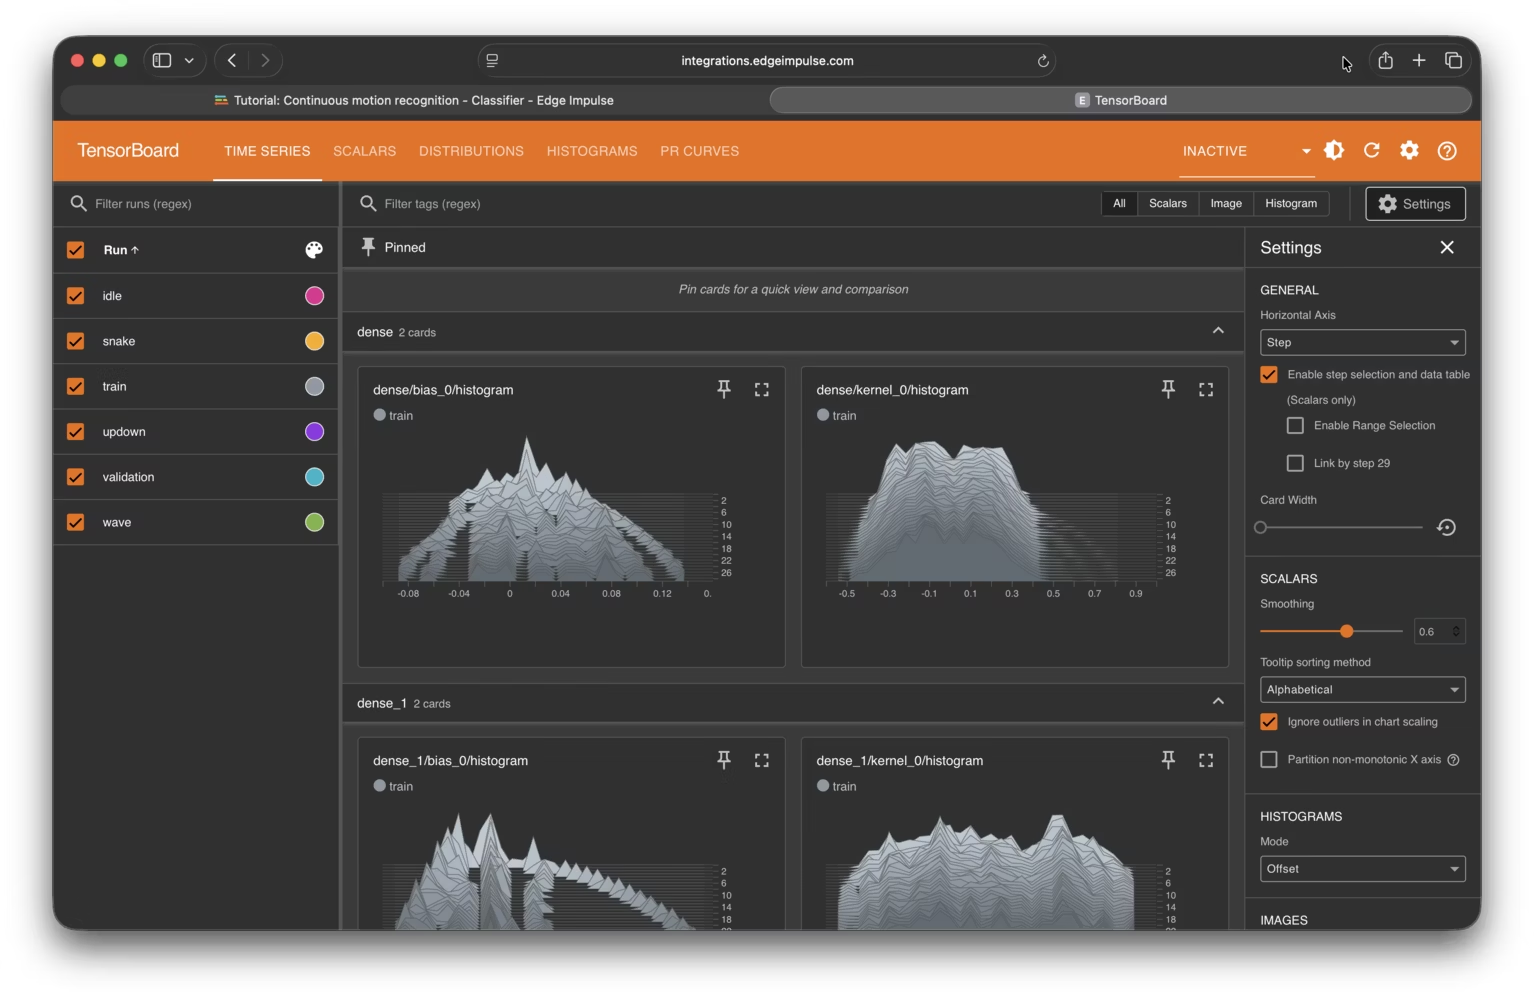
For a more detailed analysis of the model training process, you can use the TensorBoard integration. TensorBoard provides a suite of visualization tools to help you understand, debug, and optimize your model.
A TensorBoard instance can be launched easily from the learning block page, either during or after training, allowing you to explore various metrics, histograms, and other visualizations related to the training of your model. You can even export the TensorBoard logs for your learning block from your project dashboard to analyze them locally or share them with others.
Adding custom training graphs
We’ve made it possible for you to add custom training graphs, either to a custom learning block you develop or by editing exiting blocks that support expert mode, to visualize additional metrics from the training process.
To learn more, please visit the training graphs docs page.
Getting started with Edge Impulse
If you don’t have an Edge Impulse account already, you can sign up for a free account at edgeimpulse.com/signup. It only takes a minute. Once you have an account, two great resources to get started with are our documentation and forum.
Please feel free to also join our Edge Impulse Developers Discord sever to connect with a community of innovators, enthusiasts, and industry experts building the future of edge AI together. We can’t wait to see what you create!